Every Majority priority is really an economic one.
Every policy debate — environment, healthcare, education, immigration — is ultimately an economic argument. Frame it that way and it becomes bipartisan. Nobody wants America to lose to China.
Economy is the roof.
The four pillars hold it up.
Every policy debate — climate, healthcare, education, immigration — is ultimately an economic argument. Frame it that way and it becomes bipartisan. Nobody wants America to lose to China.
Market forces, not mandates.
This is not an environmental argument. It's an economic one. Wind power now costs 3.3 cents per kilowatt-hour. Solar costs 4.4 cents. Fossil fuels cost 10 cents. The market already made this decision. The only question is whether American manufacturers and workers benefit from the transition — or whether China does.
China dominates solar panel manufacturing, EV battery supply chains, and wind component production. While America debates, China builds. Every year of delay is manufacturing capacity permanently ceded to a competitor that has no interest in American prosperity.
Natural gas and oil as the bridge — not the enemy, not the target. Nuclear as the backbone. Renewables winning on price. This is not radical — it's arithmetic.
Next-generation reactors make that backbone stronger. The NRC has certified small modular reactor designs whose passive cooling systems remove decay heat without AC or DC power, additional water, or operator action, and adopted a rule letting the required emergency zone be sized to actual dose risk instead of a fixed 10-mile radius. The Energy Department screened 394 coal plant sites and found 80% are strong candidates for next-gen reactors — reusing the transmission lines already there and cutting construction costs 15–35%.
| Metric | Data |
|---|---|
| Wind cost per kWh | 3.3¢ — vs. 10¢ fossil fuels |
| Solar cost per kWh | 4.4¢ — cheapest ever |
| Renewable projects beating fossil | 81% of new projects |
| US residential electricity price (2026) | ~18.3¢/kWh — up from 17.3¢ in 2025 (EIA) |
| Deaths from oil & gas air pollution/yr | 91,000 Americans annually |
| China's EV exports (2025) | 2.6M — more than all US vehicle exports combined |
| US automaker EV writedowns (2025–26) | $47B — Ford, GM, Stellantis combined |
| Offshore wind cancel cost | $928M paid to TotalEnergies |
| STEM grads: China vs US | 6× more engineers/yr |
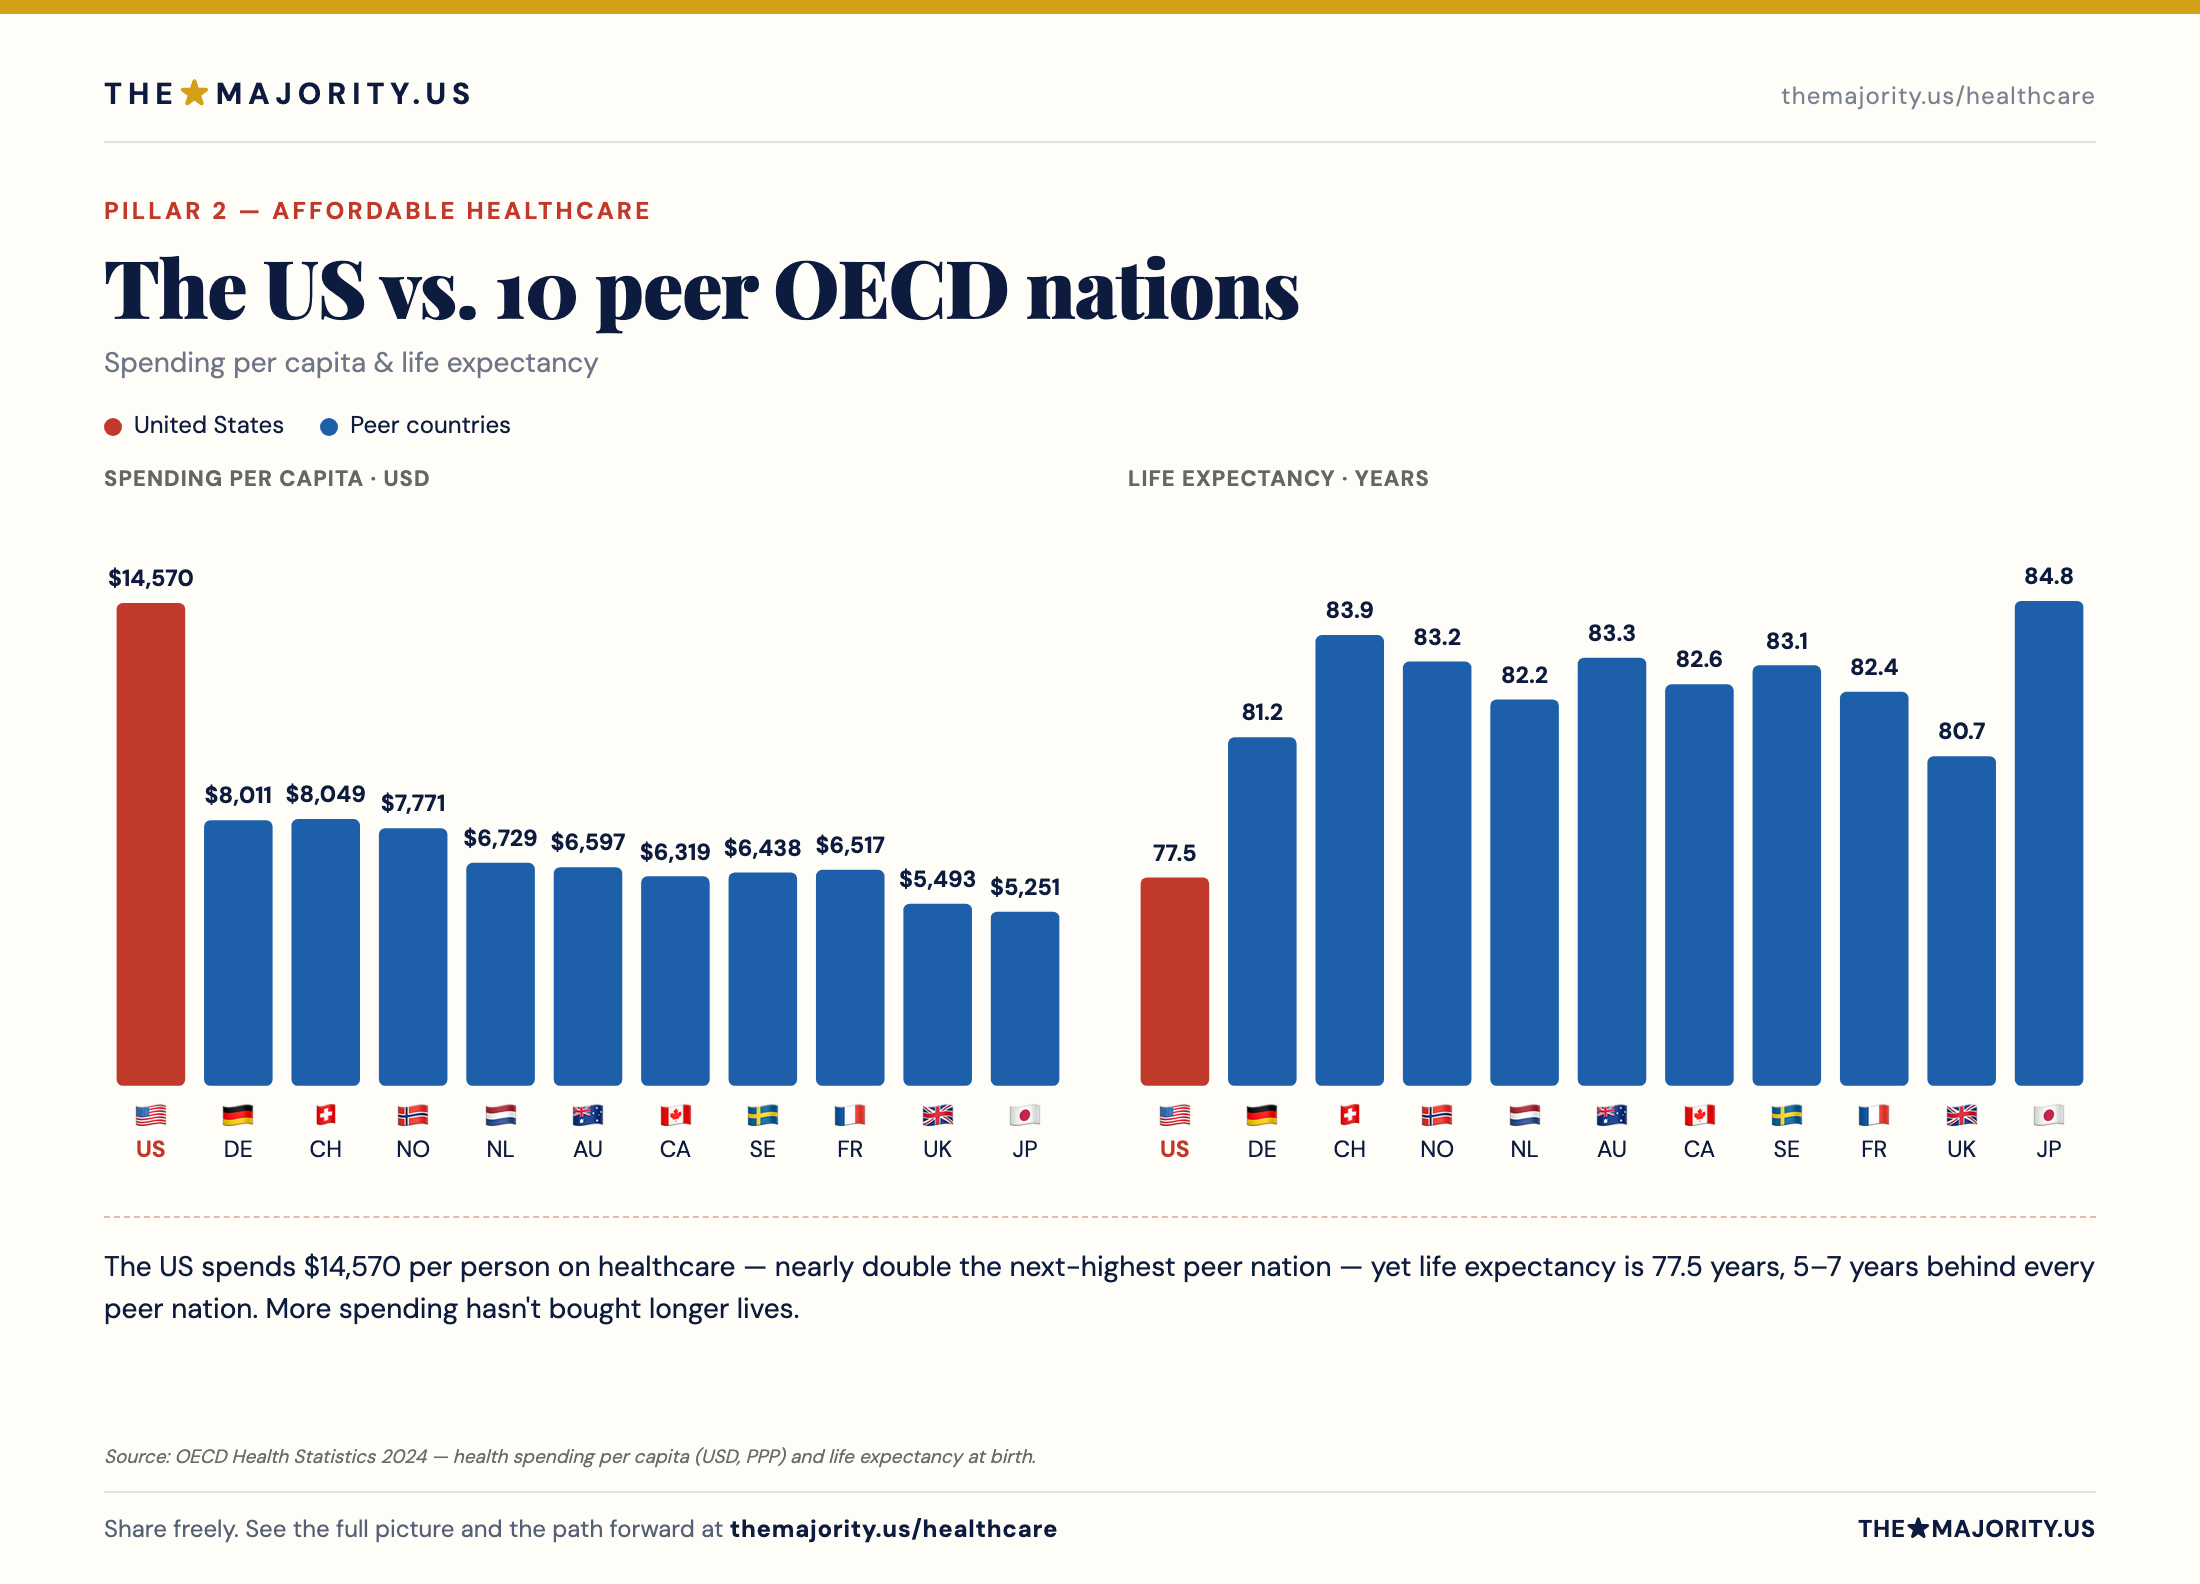
We pay 3× more. We live 6 years less.
An Economic Competitiveness Failure
$5.3 trillion a year — 18% of GDP — grows at 5.8% annually, faster than the US economy itself. US drug prices run 256% of peer nations. 1 in 6 Americans delayed care in 2024 because of cost. This is not a healthcare policy failure. It is an economic competitiveness failure — and every major US rival (Germany, Japan, Canada, South Korea) has already solved it.
Three Steps, One Direction
The Healthcare Ladder is the platform's strategic spine. Each step solves the prerequisite for the next. Step 1 — NOW: Medicare Part D for All, drug costs capped immediately. Step 2 — NEAR (3–7 yrs): build doctor supply — 14,000 new residency slots, debt forgiveness, immigrant physician fast-lane, NP expansion, AI diagnostics. Step 3 — LONG (10–15 yrs): Medicare for All, on a system built to handle it.
Funded by Reallocation, Not New Spending
Funding is not new spending — it is cost reallocation. Three streams: Medicare negotiates drug prices directly ($100B projected 10-year savings); PBM middleman reform ($100B more annually in a $600B market controlled by three firms); and employer premium savings partially redirected to Medicare as a cost swap, not a tax. The net expenditure is designed to grow no faster than CPI.
AI Makes Every Input Cheaper
For the first time in American history, AI is making every input to the system cheaper at the same time: AI-designed drugs are reaching Phase II for $6M instead of $200M, AI scribes recover 55% of physician documentation time, and AI predictive care cuts hospital readmissions up to 70%. The 15-year window is historically unique — the underlying system is getting cheaper while we build the capacity to cover everyone.
| The Healthcare Ladder | Timeline |
|---|---|
| Step 1 — NOW: Medicare Part D for All | Immediate |
| Step 2 — NEAR: Build doctor supply (residencies, NP scope, AI) | 3–7 years |
| Step 3 — LONG: Medicare for All, fully funded | 10–15 years |
| Three Funding Streams | Savings |
|---|---|
| Medicare negotiates drug prices | $100B / 10 yrs (CBO) |
| PBM middleman reform | ~$100B / yr (USC Schaeffer) |
| Employer premium redirect | Cost swap, not tax |
| Key Data | |
|---|---|
| Annual US healthcare spend | $5.3 trillion · 18% of GDP |
| Annual spend growth rate | 5.8% — above GDP |
| US vs. peer-nation drug prices | 256% higher |
| Americans who delayed care (2024) | 1 in 6 |
| Physician shortfall (by 2036) | up to 86,000 physicians |
| PBM market (3 firms, 80% of Rx) | $600B in 2024 |
| AI-designed drug to Phase II | $6M vs. $200M traditional |
| AI predictive-care readmissions | up to 70% reduction |
China runs education like building a highway. We run it like an oil change.
America changes education policy every four years like an oil change. Every eight years, the previous rewrite is reversed. China makes 15-year commitments and keeps them. The gap compounds.
China graduates roughly 77,000 STEM PhDs a year against America's ~40,000 — a gap that has widened every year since 2007. Every unfilled STEM job is GDP permanently lost. The same shortfall shows up at home: America is short 4 million homes because it doesn't train enough tradespeople to build them.
The 15-Year Bipartisan Education Compact makes education an economic strategy: closing the trades and doctor shortages, teaching the skills AI can't replace, requiring platforms to teach as well as entertain, and competing in a global economy on a timeline neither party can unilaterally reverse. States control content. The nation sets outcomes.
| The Global Competition | Numbers |
|---|---|
| China STEM PhDs/year | ~77,000 (2025 est.) |
| US STEM PhDs/year | ~40,000 |
| Gap trend | Widening every year since 2007 |
| US STEM job shortfall by 2030 | 1.4 million positions |
| US housing shortage | 4 million homes |
| Doctors blocked from residency (2025) | 9,500+ |
| Where the Majority Agrees | Focus |
|---|---|
| Skilled Trades | Elevate to 4-yr credential — solves the housing shortage |
| Doctor Supply | Expand medical school & residency capacity |
| AI & Robotics Literacy | Core subject at every level |
| PreK → Postgraduate Investment | Sustained, depoliticized funding |
The world's best have chosen America for over 250 years.
Immigrants Create Jobs and Grow America
Immigrants generate $2.1 trillion in US GDP — 18% of national output despite being 14.3% of the population. 46% of Fortune 500 companies were founded by immigrants or their children. Immigrants don't steal jobs. They create them. The competition is in Beijing, not at the border.
The Economic Case
The 20M legal pathway over 15 years isn't generosity — it's arithmetic. $6 trillion in economic advantage over mass deportation. $4.64 trillion in deficit reduction. Social Security extended by 7–8 years through FICA contributions from 20M legal workers.
Win the Global Race for Talent
Canada committed $1.2 billion to recruit scientists. The EU launched a €500M “Choose Europe” program. Ten countries are actively running programs to hire the engineers America trained. The Scientist Fast-Lane fixes this: 12-month permanent residency, same-day family, backlog eliminated.
No Legal ID. No Legal Job.
Legal workers need a legal credential. The Majority ID System ties national work authorization to the state driver's license — which ~90% of working-age Americans already carry — with an expiration date that drives renewal and re-verification. Federal law requires employers to check it at hire: no ID, no job. No new federal database, no new agency — just a work-authorization field on a card Americans already carry. 68% bipartisan support.
| The 5 Legal Pathways | Goal (15yr) |
|---|---|
| STEM & High-Skilled Workers | 5M — competing for global talent |
| Agricultural & Essential Workers | 4M — backbone of food supply |
| Healthcare Workers | 3M — physician & nurse fast-lane |
| Skilled Trades & Shipbuilding | 4M — housing + industrial capacity |
| Entrepreneurs, Family, Military | 4M — job creators + service |
| The Majority ID System | Mechanism |
|---|---|
| Built on state driver's license | ~90% coverage, already issued |
| Mandatory at hire (employer check) | No ID = no job |
| Expiration date | Drives renewal + re-verification |
| New federal database required | None — no new agency |
| Bipartisan public support | 68% across party lines |
| The Economic Case | |
|---|---|
| Immigrant GDP contribution | $2.1T — 18% of US output |
| 20M pathway vs. deportation | +$6T economic advantage |
| Deficit reduction (20M pathway) | −$4.64T over 15 years |
| Social Security extension | +7–8 years of solvency |
| Fortune 500 immigrant-founded | 46% of companies |
| Countries recruiting US scientists | 10 active programs globally |
The engine behind the platform.
Two systems power TheMajority.us: Maj, the AI civic agent that translates policy into plain English — and the Candidate Tracker, which scores every senator against what the majority actually supports.
Majority opinion is the compass.
Facts are the map.
You decide the destination.
100 senators. Real scores.
Live data.
Every US Senator scored on how their actual votes compare to documented majority opinion across all four pillars. Updated weekly from Congress.gov. No editorial discretion on the scores — just the math.
Majority Alignment Score
0–100 score built from four pillar sub-scores. Green 70+, Amber 50–69, Red below 50. Based on votes where 60%+ polling establishes a majority position.
Economic Impact Score
Three sub-metrics: GDP & Jobs, Fiscal Impact, and Competitiveness vs. China. Derived from votes weighted by direct economic consequence.
Political Spectrum
Far Left → Far Right positioning using DW-NOMINATE academic data. Independent of the MAS — ideology and majority alignment are separate measurements.
Constituent Favorability
How voters feel about their senator from Morning Consult, alongside how they actually vote. The gap between those two numbers is the platform’s core story.
By State View
Every state summarized — average MAS, average favorability, pillar averages, highest and lowest alignment incumbents. All filterable and sortable.
Challengers — September 2026
Every filed candidate scored on stated platform positions and endorsement profile. The endorsement gap reveals when what they say diverges from who funds them.